
Table of Contents
Procurement KPIs with AI: Essential Dashboard for CFOs and CPOs in LATAM 2026
Equipo EGIXIA
Procurement Analytics
Which procurement KPIs should I track in 2026?
The 12 essential KPIs are: Savings Realization Rate, Cost Avoidance, Spend Under Management, PR-to-PO Cycle Time, % Guided Buying, Cost per PO, Supplier Risk Score, % critical suppliers with contingency, MTTD, % spend with diverse suppliers, carbon intensity, and % suppliers with ESG certification.
Key Takeaways
- 12 essential KPIs grouped by savings, efficiency, risk, and sustainability
- Savings Realization Rate jumps from 55% to 90% with AI
- PR-to-PO cycle time drops from 21 to 4 days with automation
- Cost per PO falls from USD 100 to USD 25 with guided buying
- Executive dashboard ships in 60 days using ERP data
Executive Summary
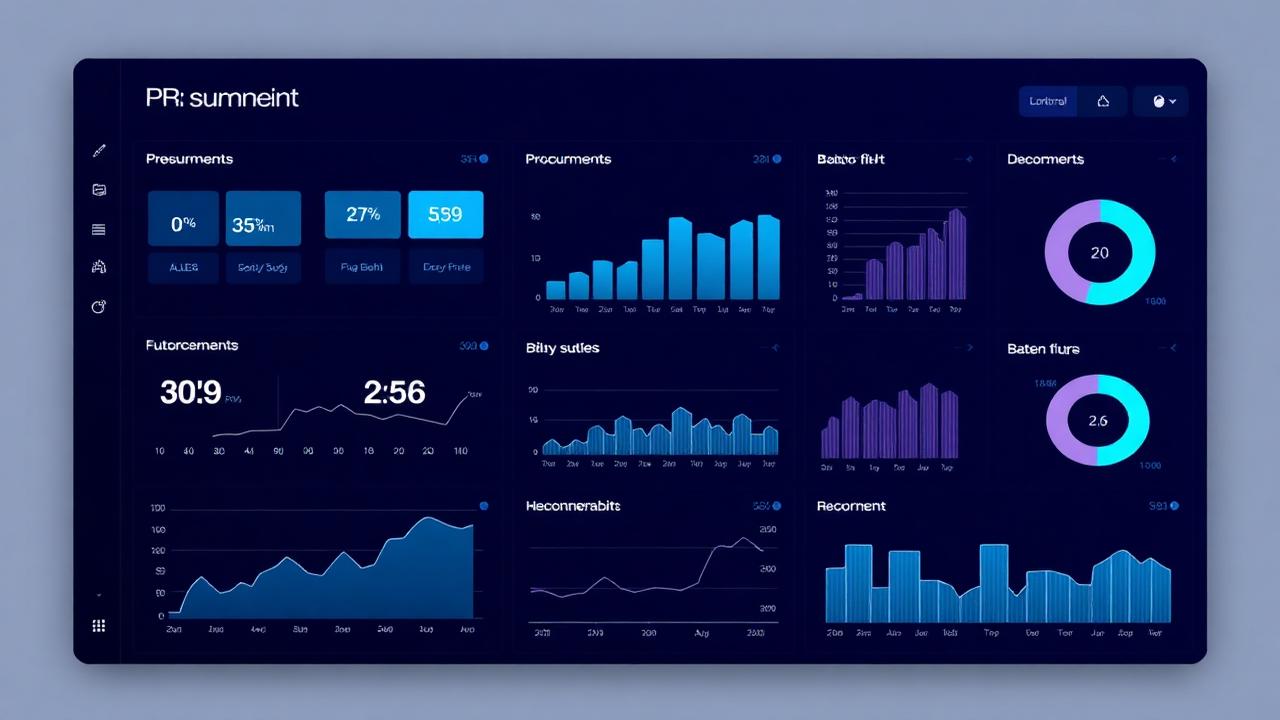
Measuring procurement with static KPIs in Excel is no longer enough. Leading LATAM companies (Falabella, Bancolombia, Grupo Bimbo, Natura) are moving to real-time AI dashboards that combine ERP, contract, risk, and market data to predict variances before they happen. This article lists the 12 must-have KPIs grouped into 4 categories: savings, efficiency, risk, and sustainability.
Category 1: Savings & Value KPIs
1. Savings Realization Rate
Formula: (Realized savings / Negotiated savings) × 100
LATAM benchmark: 55-65% (without AI) / 85-92% (with AI and automatic tracking)
2. Cost Avoidance
Formula: (Initial quoted price − Negotiated price) × volume
Benchmark: 3-7% of addressable spend.
3. Spend Under Management (SUM)
Formula: Procurement-managed spend / Total spend × 100
LATAM benchmark: 60-70% (traditional) / 90%+ (AI & guided buying).
Category 2: Operational Efficiency KPIs
4. PR-to-PO Cycle Time
LATAM benchmark: 14-21 days (manual) → 2-4 days (with AI and auto approvals).
5. % of Catalog Buying (Guided Buying)
Measures how much spend flows through pre-approved catalogs.
Benchmark: 75%+ is world-class.
6. Cost per Purchase Order
LATAM benchmark: USD 80-120 (manual) → USD 18-30 (automated).
Category 3: Risk KPIs
7. Average Supplier Risk Score
Weighted score (financial, operational, compliance, ESG) calculated by AI in real time.
8. % of Critical Suppliers with Contingency Plan
2026 target: 100% of Tier-1 suppliers.
9. Mean Time to Detect Incident (MTTD)
With AI monitoring news and public records, MTTD drops from weeks to hours.
Category 4: Sustainability & Diversity KPIs
10. % of Spend with Diverse Suppliers (MBE/WBE)
LATAM benchmark: under 5% today; 2030 corporate target: 15%+.
11. tCO₂e per USD Spent (Carbon Intensity)
Enables apples-to-apples comparisons across categories and suppliers.
12. % of Suppliers with ESG Certification
Measures base maturity. Target: 60%+ of spend with certified suppliers.
How to build the AI dashboard in 60 days
- Week 1-2: ERP connection (SAP, Oracle, Totvs, Siigo) and data cleansing.
- Week 3-4: automatic spend classification via UNSPSC taxonomy.
- Week 5-6: external data integration (risk, ESG, market).
- Week 7-8: exec dashboard release and team enablement.
Next steps
Book a demo of the EGIXIA procurement dashboard and see your own data in under 72 hours.
Frequently Asked Questions
Savings Realization Rate, because it ties procurement-negotiated savings directly to the P&L. Without AI, 35-45% of negotiated value is typically lost.
Topics